Onshore vs Offshore Wind: Costs, Pros and Cons
Onshore vs offshore wind, with IRENA's 2024 costs: onshore at $0.034/kWh, offshore at $0.079/kWh, and what the extra build cost buys.
• For plants commissioned in 2024, IRENA's global average cost of electricity was $0.034/kWh for onshore wind and $0.079/kWh for offshore wind.
• The build cost gap is wider than the energy-cost gap: about $1,041/kW onshore against $2,852/kW offshore.
• Offshore is still usually more expensive energy. It earns its place where the wind is strong, the sea is buildable, and land near the cities is not.
• China pulls the offshore average down ($0.056/kWh). The United States, in the same report, sits above $0.123/kWh.
Onshore vs offshore wind is a choice about where the wind is and what it costs to stand a turbine there, not a choice about two different laws of physics. Both machines are three-bladed rotors driving a generator. The same cube of wind speed applies. What changes is the foundation, the cable, the size of the rotor, and the price of a year of energy. IRENA's 2024 cost report is the cleanest public comparison we have, and it is a global average of plants that actually reached commissioning, not a developer's slide.
Onshore vs offshore wind: what 2024 cost
IRENA's global weighted average levelised cost of electricity (LCOE) for onshore wind projects commissioned in 2024 was $0.034 per kWh. New utility solar was $0.043 and hydropower $0.057, so onshore wind was the cheapest new renewable in that set. The onshore average had fallen 70% from $0.113/kWh in 2010. It also ticked up 3% from 2023, which IRENA ties to financing costs and to lower capacity factors in important markets. The spread is wide: the 5th to 95th percentile of 2024 onshore projects ran from $0.024 to $0.075/kWh. China ($0.029) and Brazil ($0.030) were under the average. A project in a difficult market is not "the" onshore price.
Offshore wind's 2024 average was $0.079 per kWh, down 62% from $0.208 in 2010, and up 4% from a low of $0.076 in 2023. The 5th to 95th percentile was $0.049 to $0.155. Geography dominates the average. China's offshore LCOE was $0.056/kWh. Europe's rose about 16% year on year, from $0.069 to $0.080. In the United States, IRENA puts offshore wind above $0.123/kWh. Quoting the global $0.079 as if it were the price of a US Atlantic project will make the project look cheaper than the report says it is.
| Onshore wind, 2024 | Offshore wind, 2024 | |
|---|---|---|
| Global average LCOE | $0.034/kWh | $0.079/kWh |
| Change since 2010 | −70% (from $0.113) | −62% (from $0.208) |
| Total installed cost | $1,041/kW | $2,852/kW |
| Cheap end of the map | China $0.029, Brazil $0.030 | China $0.056 |
| Dear end called out by IRENA | 95th percentile $0.075 | United States above $0.123; 95th percentile $0.155 |
Installed cost is the cheque to build a kilowatt, before you know how windy the site is. Offshore at $2,852/kW is about 2.7 times onshore at $1,041/kW. The LCOE ratio is smaller, about 2.3 times ($0.079 / $0.034). LCOE also folds in financing and operations, so you cannot read a capacity factor straight out of that ratio. You can say this much: the energy-cost gap is narrower than the build-cost gap, which is what a windier fleet looks like in a cost table. IRENA also records the offshore fleet growing from 3.1 GW in 2010 to 82.9 GW at the end of 2024, with 8.6 GW added that year. It is no longer a demonstration. It is still the more expensive of the two.
A worked 100 MW at the global average
Apply the installed-cost averages to a 100 MW plant. They are averages, so this is a scale check, not a budget.
| Installed cost at the 2024 average | |
|---|---|
| 100 MW onshore | 100,000 kW × $1,041 = $104 million |
| 100 MW offshore | 100,000 kW × $2,852 = $285 million |
| Difference | About $181 million more to build the same nameplate at sea |
The sea plant has to earn that extra capital back with more megawatt-hours, a longer life, or a contract that pays more. If the two plants produced the same energy every year, offshore electricity would carry a much heavier capital charge. Developers still build at sea when the wind resource, the grid connection into a coastal city, and the lack of land make the extra megawatt-hours real. They should not build at sea to "be greener". A kilowatt-hour at $0.034 and a kilowatt-hour at $0.079 are the same electron. The cheaper one displaces more fossil fuel per dollar.
Offshore wind turbine: a bigger machine, a harder foundation
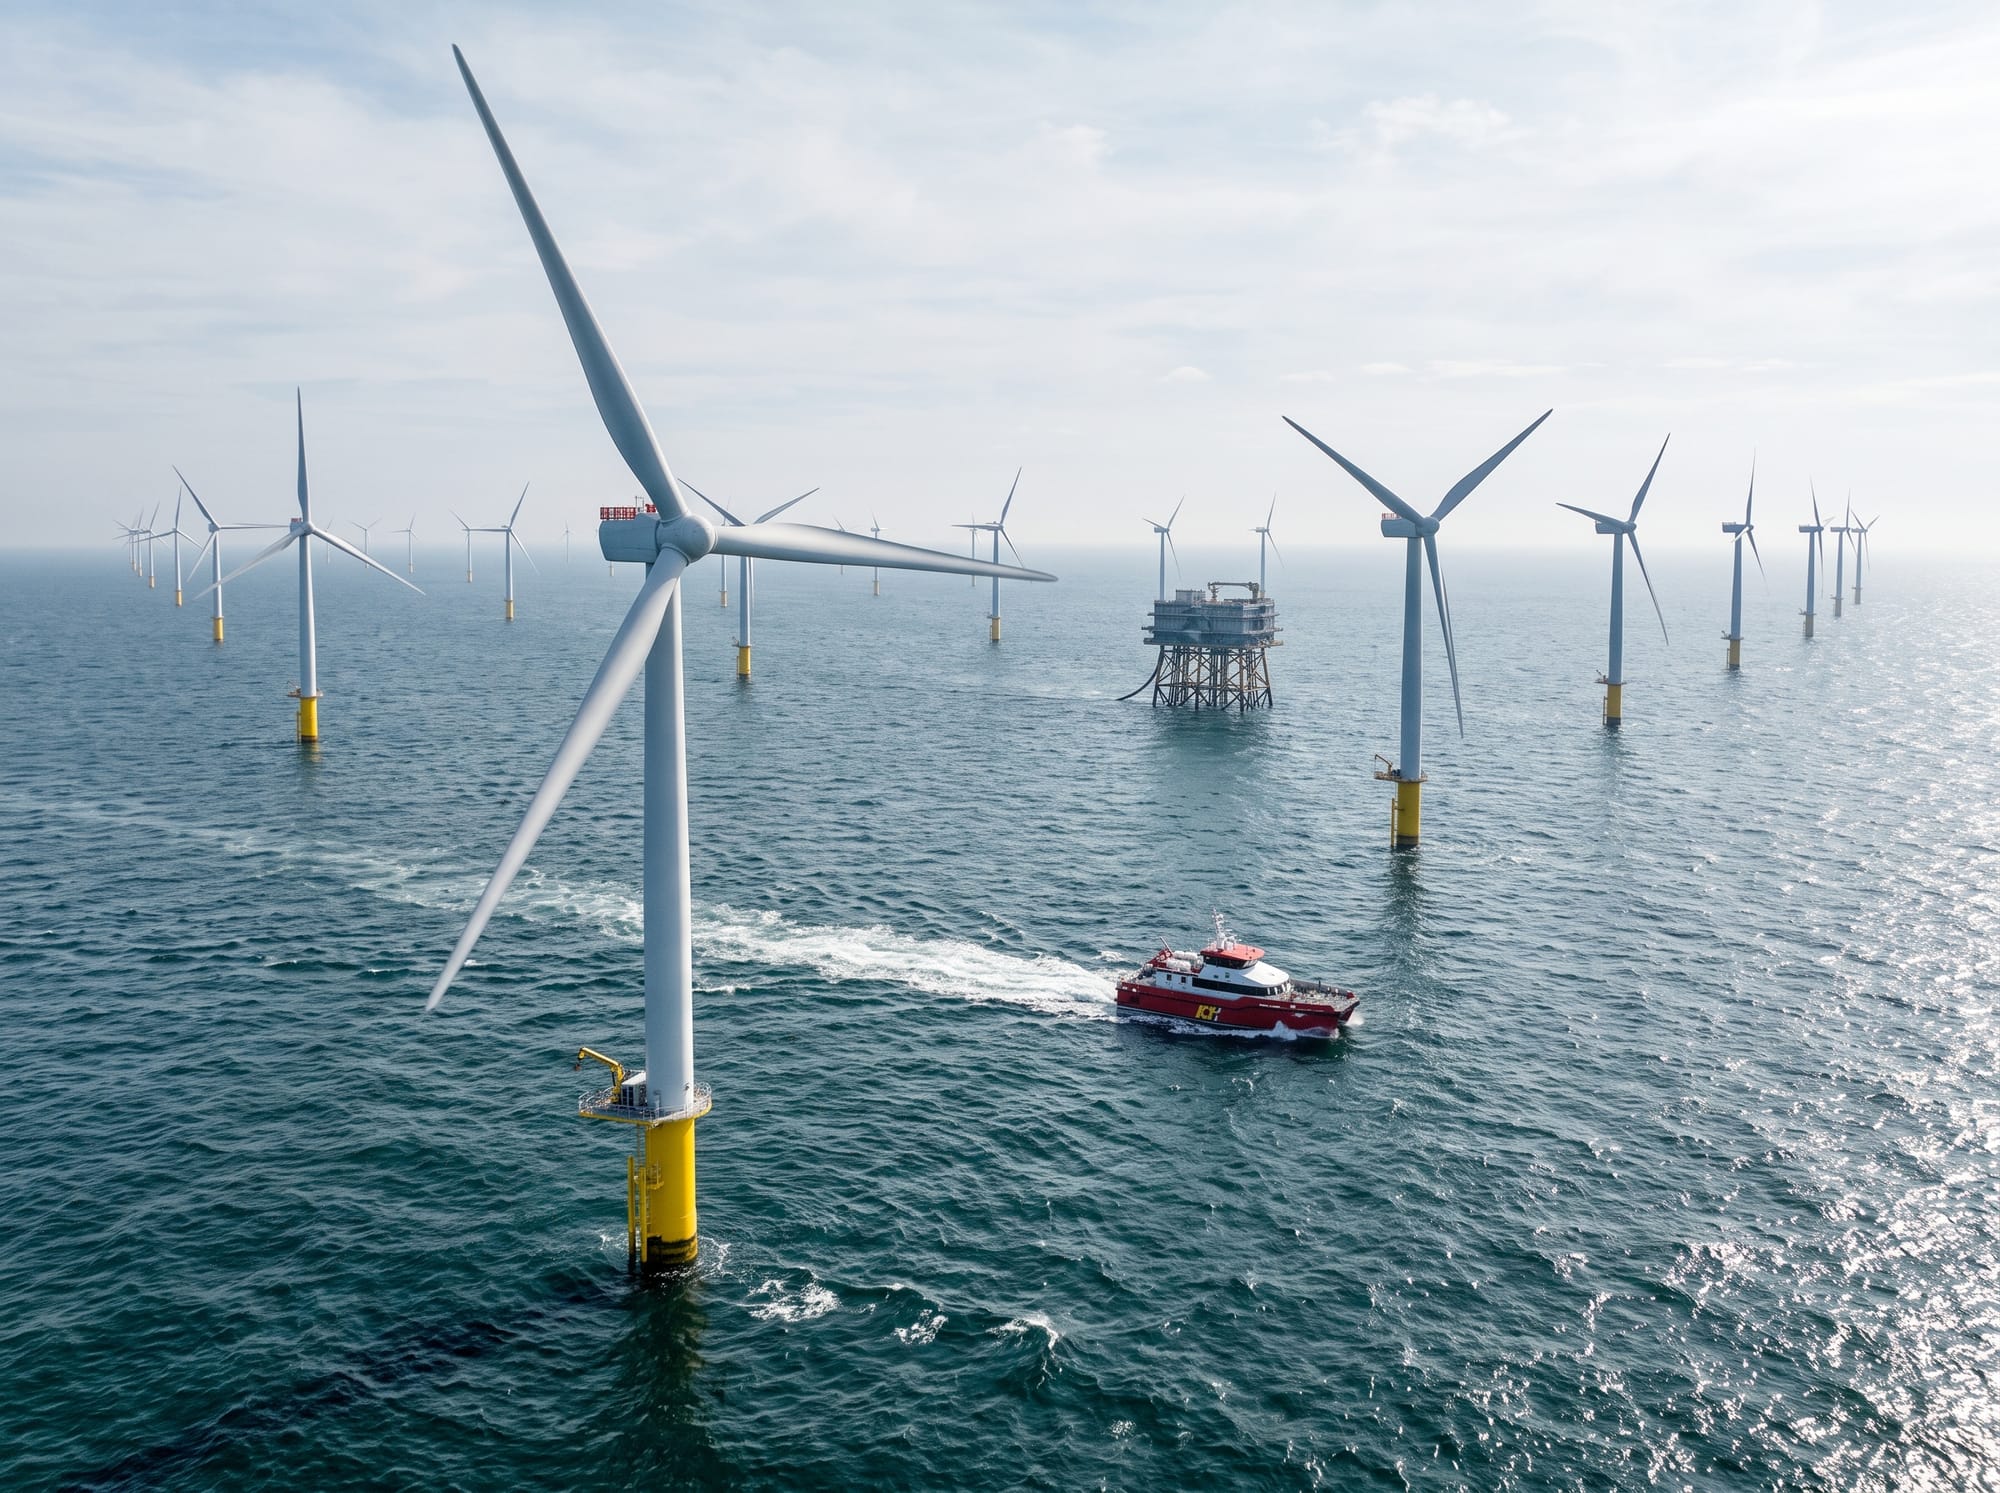
An offshore wind turbine is the same idea as an onshore one, scaled up and stood on a structure that can live in salt water. Rotors have moved past 200 m. Vestas's V236-15.0 MW is one commercial example of that size class. A larger disk catches more wind per foundation, which matters when each foundation is a marine construction project rather than a concrete pad and a crane on a road.
Fixed foundations, usually a monopile or a jacket, need a seabed that is not too deep. Cables run back to shore, and the substation that collects the farm is itself an offshore platform. Floating foundations exist for deeper water. They are a smaller and generally dearer part of the fleet. [CHECK the foundation type and water depth on any project you cite. "Offshore" alone does not tell you which engineering you are paying for.]
The weather window is the hidden cost. An onshore crane can wait for a calm morning. An offshore installation vessel cannot sit on hire through a month of swell without the budget noticing. That is one reason offshore cost is lumpier, and why a single expensive market moves the global average, as the United States does in the 2024 report.
Pros and cons that survive the brochure
| Onshore | Offshore | |
|---|---|---|
| Energy cost, 2024 global average | $0.034/kWh. Often the cheapest new power plant. | $0.079/kWh. Cleaner than many fossils in IRENA's comparison, dearer than onshore. |
| Build cost | About $1,041/kW. | About $2,852/kW. |
| Wind | Good on ridges, plains and passes. Turbulent near towns. | Usually stronger and smoother. That is the point of going to sea. |
| Conflict | Landscape, noise and roads are the political project. | Fisheries, shipping, birds and marine mammals, plus the view if the farm is close inshore. |
| Grid | Often nearer existing lines, until the best sites are taken. | A long cable into the coastal cities that need the power. |
| Best use | The default, wherever a wind study and a permit line up. | Crowded coasts with a strong sea resource and a public that will not take hundreds of towers inland. |
IRENA's wider finding sits under both columns: 91% of new utility-scale renewable capacity commissioned in 2024 undercut the cheapest new fossil alternative. Onshore wind did most of that work. Offshore wind's job is not to win a cost contest against a windy plain in Brazil. It is to deliver large blocks of power next to coasts that have used up their easy onshore sites.
Real: onshore wind is among the cheapest new electricity on earth, at $0.034/kWh in the 2024 global average. Offshore is a proven, growing fleet, and China builds it relatively cheaply.
Hype: "offshore is the future, so it must be cheaper." The bill says otherwise, outside the best seas.
Also hype: treating one US project, or one Chinese project, as the world price.
Verdict: build onshore where the wind and the permit exist. Build offshore where the sea resource is excellent and the alternative is a more expensive fossil plant, not where it merely sounds more modern.
Frequently asked questions
Is onshore or offshore wind cheaper?
Onshore, on IRENA's 2024 averages: $0.034/kWh and $1,041/kW, against $0.079/kWh and $2,852/kW offshore. Individual projects overlap. The US offshore figure in that report is higher still.
What is an offshore wind turbine?
A wind turbine on a foundation in the sea, fixed or floating, with a subsea cable. The rotor, generator and pitch system do the same job as on land. The foundation and the installation vessel are the expensive difference.
Why build offshore wind if it costs more?
Because some coasts have strong, steady wind and do not have a spare ridge next to the city. More energy per megawatt, and a cable into a coastal demand centre, can justify a higher build cost. It does not justify it everywhere.
How big is offshore wind now?
IRENA records 82.9 GW installed worldwide at the end of 2024, up from 3.1 GW in 2010. Onshore remains the larger fleet by a wide margin. The report's cost chapter is the place to check the latest split.
Does offshore wind always have a higher capacity factor?
The better sites do, which is why the energy-cost gap is narrower than the build-cost gap. It is not automatic. A poor sea, a curtailed cable or a year of downtime will waste the advantage. Read the project's own energy yield, not a slogan.
Where can I see both kinds on a map?
Hornsea 2 in the UK North Sea is a large offshore farm. Alta Wind in California, Lake Turkana in Kenya and Lagoa dos Ventos in Brazil are large onshore examples. Confirm megawatts on the operator's page.
Those projects are pins on our project atlas. The atlas is a guide to where landmark plants sit. For how the machine itself turns wind into electricity, read how wind turbines work, including the cube-of-wind-speed example.